Death and taxes are supposed to be the only two certainties in this world; however, this year a majority of Americans are feeling uncertain about their tax future. According to a new Gallup poll, 56% of U.S. adults are unsure whether the new tax bill signed into law by the president last December will cause their taxes to go up, down, or stay the same.
Much of the confusion around taxes is due to the immense complexity of tax codes at federal, state, and local levels. What an individual actually pays in taxes each year is based on myriad factors—one of the most significant of which is location.
In addition to changes at the federal level this year, each state and many local jurisdictions have their own unique set of tax laws that residents must keep track of. In Texas, for example, residents don’t pay state individual income or state property tax, but they are subject to hefty sales and local property taxes. Despite saving on individual income tax, residents in Texas are still taxed moderately (see below) compared to residents in other states.
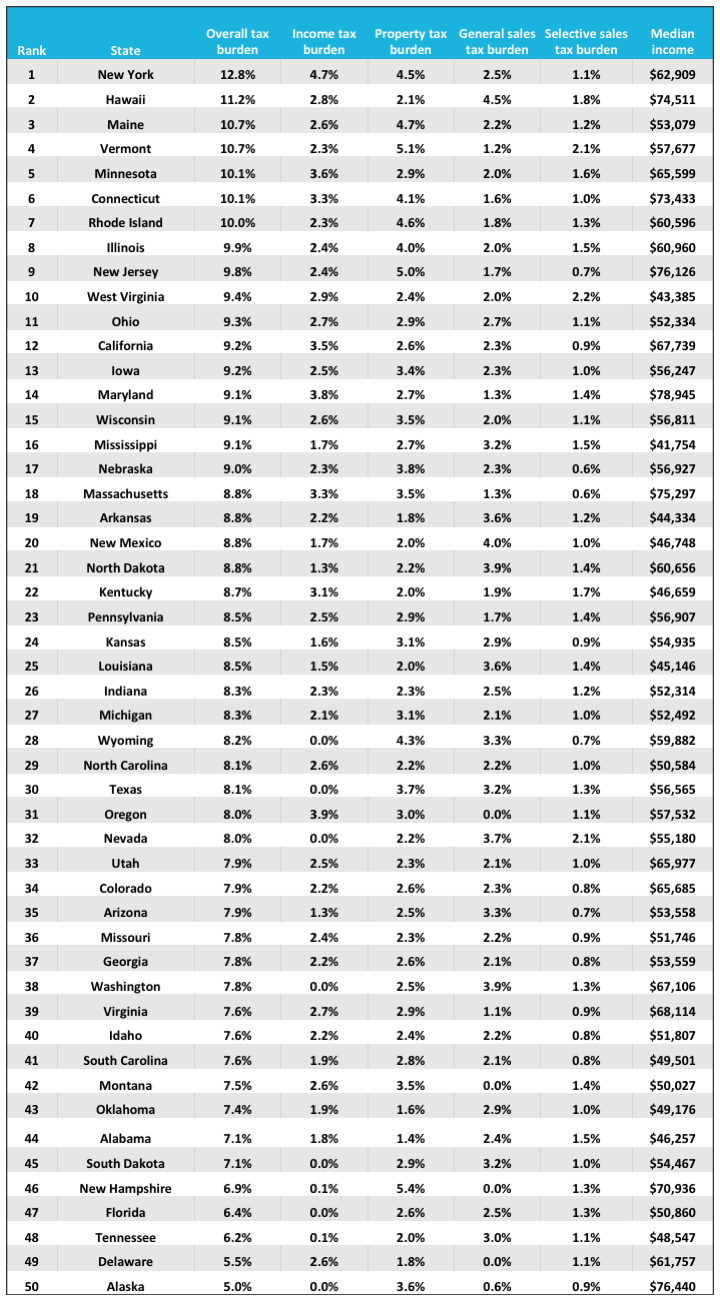
One way to sift through the noise of local differences in tax revenue sources, rates, and brackets is to look at overall tax burdens. A tax burden is the percentage of personal income that goes towards taxes. To determine which states have the highest and lowest tax burdens, the data team at Credit Sesame calculated what percentage of total state personal income is spent on state and local individual income, property, and sales tax. The results help show which Americans will pay the most and least in taxes. Here are the most and least taxed states.
Top 10 Most Taxed States

1. New York
- Overall tax burden: 12.8%
- Income tax burden: 4.7%
- Property tax burden: 4.5%
- General sales tax burden: 2.5%
- Selective sales tax burden: 1.1%
- Median income: $62,909

2. Hawaii
- Overall tax burden: 11.2%
- Income tax burden: 2.8%
- Property tax burden: 2.1%
- General sales tax burden: 4.5%
- Selective sales tax burden: 1.8%
- Median income: $74,511

3. Maine
- Overall tax burden: 10.7%
- Income tax burden: 2.6%
- Property tax burden: 4.7%
- General sales tax burden: 2.2%
- Selective sales tax burden: 1.2%
- Median income: $53,079
Recommended Content

4. Vermont
- Overall tax burden: 10.7%
- Income tax burden: 2.3%
- Property tax burden: 5.1%
- General sales tax burden: 1.2%
- Selective sales tax burden: 2.1%
- Median income: $57,677

5. Minnesota
- Overall tax burden: 10.1%
- Income tax burden: 3.6%
- Property tax burden: 2.9%
- General sales tax burden: 2.0%
- Selective sales tax burden: 1.6%
- Median income: $65,599

6. Connecticut
- Overall tax burden: 10.1%
- Income tax burden: 3.3%
- Property tax burden: 4.1%
- General sales tax burden: 1.6%
- Selective sales tax burden: 1.0%
- Median income: $73,433

7. Rhode Island
- Overall tax burden: 10.0%
- Income tax burden: 2.3%
- Property tax burden: 4.6%
- General sales tax burden: 1.8%
- Selective sales tax burden: 1.3%
- Median income: $60,596

8. Illinois
- Overall tax burden: 9.9%
- Income tax burden: 2.4%
- Property tax burden: 4.0%
- General sales tax burden: 2.0%
- Selective sales tax burden: 1.5%
- Median income: $60,960

9. New Jersey
- Overall tax burden: 9.8%
- Income tax burden: 2.4%
- Property tax burden: 5.0%
- General sales tax burden: 1.7%
- Selective sales tax burden: 0.7%
- Median income: $76,126

10. West Virginia
- Overall tax burden: 9.4%
- Income tax burden: 2.9%
- Property tax burden: 2.4%
- General sales tax burden: 2.0%
- Selective sales tax burden: 2.2%
- Median income: $43,385
Top 10 Least Taxed States

1. Alaska
- Overall tax burden: 5.0%
- Income tax burden: 0.0%
- Property tax burden: 3.6%
- General sales tax burden: 0.6%
- Selective sales tax burden: 0.9%
- Median income: $76,440

2. Delaware
- Overall tax burden: 5.5%
- Income tax burden: 2.6%
- Property tax burden: 1.8%
- General sales tax burden: 0.0%
- Selective sales tax burden: 1.1%
- Median income: $61,757

3. Tennessee
- Overall tax burden: 6.2%
- Income tax burden: 0.1%
- Property tax burden: 2.0%
- General sales tax burden: 3.0%
- Selective sales tax burden: 1.1%
- Median income: $48,547

4. Florida
- Overall tax burden: 6.4%
- Income tax burden: 0.0%
- Property tax burden: 2.6%
- General sales tax burden: 2.5%
- Selective sales tax burden: 1.3%
- Median income: $50,860

5. New Hampshire
- Overall tax burden: 6.9%
- Income tax burden: 0.1%
- Property tax burden: 5.4%
- General sales tax burden: 0.0%
- Selective sales tax burden: 1.3%
- Median income: $70,936

6. South Dakota
- Overall tax burden: 7.1%
- Income tax burden: 0.0%
- Property tax burden: 2.9%
- General sales tax burden: 3.2%
- Selective sales tax burden: 1.0%
- Median income: $54,467

7. Alabama
- Overall tax burden: 7.1%
- Income tax burden: 1.8%
- Property tax burden: 1.4%
- General sales tax burden: 2.4%
- Selective sales tax burden: 1.5%
- Median income: $46,257

8. Oklahoma
- Overall tax burden: 7.4%
- Income tax burden: 1.9%
- Property tax burden: 1.6%
- General sales tax burden: 2.9%
- Selective sales tax burden: 1.0%
- Median income: $49,176

9. Montana
- Overall tax burden: 7.5%
- Income tax burden: 2.6%
- Property tax burden: 3.5%
- General sales tax burden: 0.0%
- Selective sales tax burden: 1.4%
- Median income: $50,027

10. South Carolina
- Overall tax burden: 7.6%
- Income tax burden: 1.9%
- Property tax burden: 2.8%
- General sales tax burden: 2.1%
- Selective sales tax burden: 0.8%
- Median income: $49,501
Methodology & Full Results
Tax burdens were calculated by dividing tax revenue by personal income for each state. Total personal income by state was sourced from the U.S. Bureau of Economic Analysis (BEA), State Personal Income (2017). The BEA defines personal income as “the income received by, or on behalf of, all persons from all sources: from participation as laborers in production, from owning a home or business, from the ownership of financial assets, and from government and business in the form of transfers. It includes income from domestic sources as well as the rest of world. It does not include realized or unrealized capital gains or losses.”
The tax revenue data used in this analysis is from the U.S. Census Bureau, State and Local Government Finances 2015. The data was released on 10/19/2017 and is the most recent available. Both state and local tax data were used. It’s important to note that comparing tax burdens across states can be challenging because statistics on tax revenue reflect taxes a state collects from all activity within the state, not just the taxes paid by its residents. To increase the relevancy of the analysis to the residents of each state, only individual income, property, general sales, and selective sales taxes were included. Selective sales tax is predominantly driven by the sale of gasoline, alcohol, tobacco, and public utilities.