


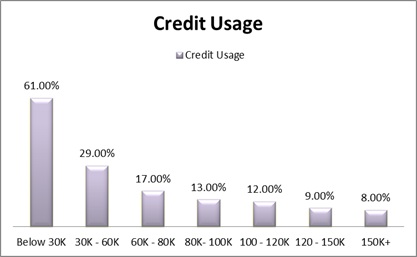
Credit Usage
Consumers who earn below $60K in income are often either well above or dangerously close to exceeding healthy levels of credit usage. The recommended range of credit usage is to keep it to around 10 percent or less.
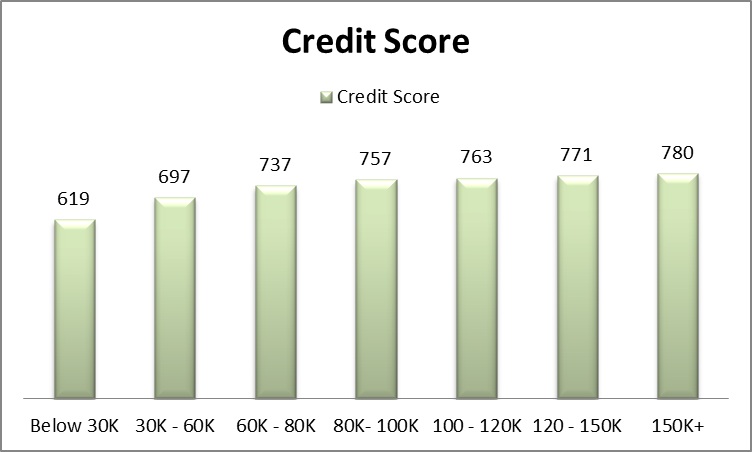
Credit Score
While income doesn’t impact a person’s credit score directly, it does play a large indirect role. People with higher credit scores tend to make more money. This is because income can have a big impact on the things that do affect your credit score:
- On time payments – People with higher incomes may be more able to meet the minimum payments on time. They may even have someone helping them manage their finances.
- Length of credit history – Typically, the longer you’re in the workforce and the more you work your way up, the more money you make. Consumers with higher incomes have likely been in the workforce for a longer period of time.
- Credit Card utilization/credit usage – This is the percent of available credit you have available that you use. People with higher income may have higher debt (see debt chart below), but they also have higher credit limits, making their credit utilization much lower than other income groups.
- Hard credit inquires – This is when a lender requests a credit check in order to decide whether or not to extend a line of credit to you, such as an auto loan. Consumers with higher incomes may be able to purchase those loans outright and avoid the hard credit inquiry.
It’s important to note that not all consumers with higher incomes are in good financial shape. Many have over-extended themselves and spend the majority of their monthly income paying off debt.
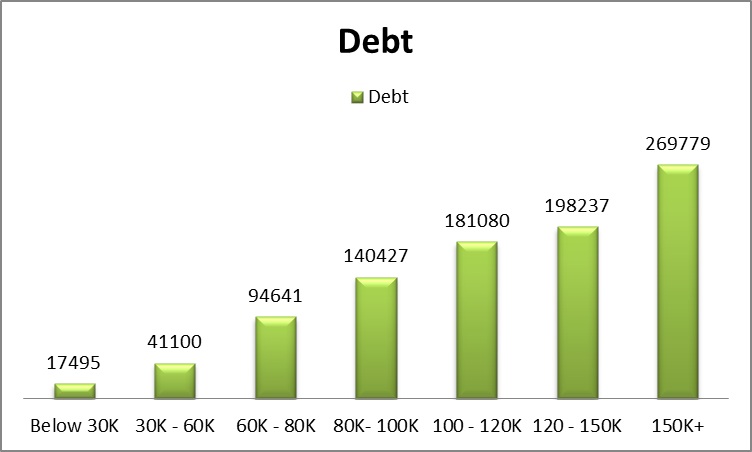
Debt
The numbers below represent the total amount of debt a consumer has based on their income level. This figure includes mortgage, credit card, auto and student loan debt. As you can see, the higher the income bracket – the more debt a consumer tends to have.
Debt-To-Income (DTI)
A person’s debt-to-income ratio is the percentage of their monthly gross income that goes toward paying debts. Our data shows that people who make $80,000-$120,000 tend to have the highest debt-to-income ratios. Consumers with the lowest debt-to-income ratios fall on opposite ends of the spectrum, with those who earn below $30,000 and above $150,000 posting a 16% and 14% DTI respectively.
This is likely due to two different reasons. The higher income earners may have more debt, but they also have more income to pay for that debt and thus their DTI is lower. The lowest income earners have the opposite problem. They would probably like to receive more access to credit but can’t necessarily qualify for it, so they have less of an opportunity to actually get into debt. Hence, the lower DTI ratio.
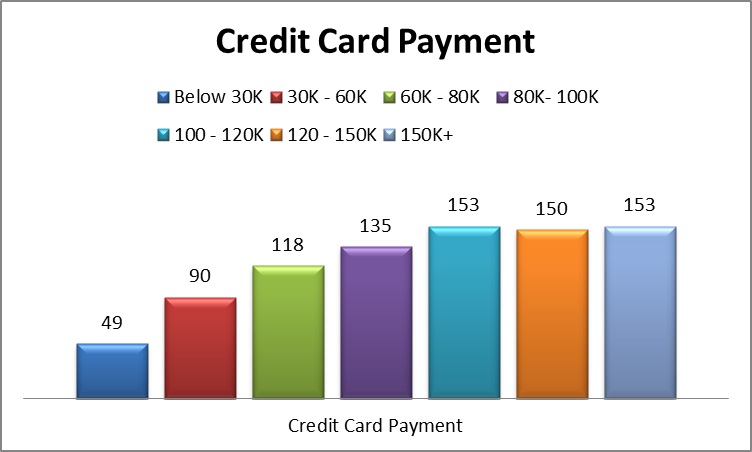
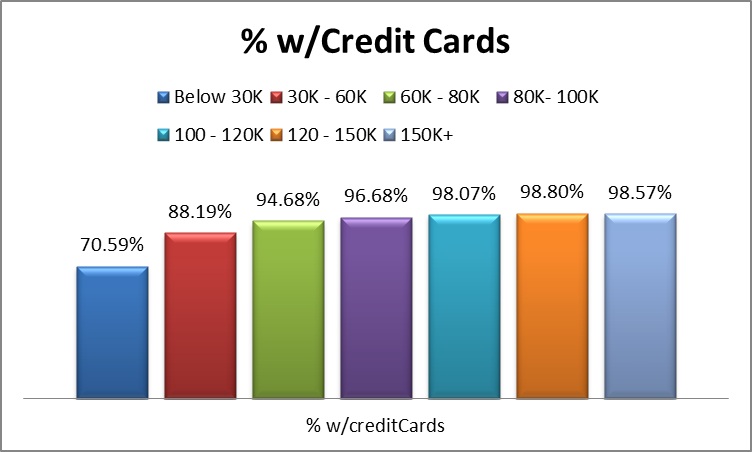
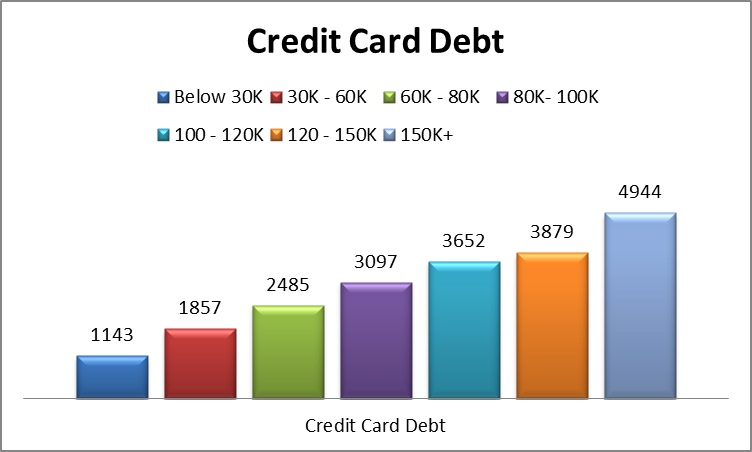
Credit Cards
The below charts reflect the amount of money that you need to pay each month in order to remain current on your debt and the amount of credit card debt consumers in various income brackets have. Again, debt is directly correlated with income. The higher the income, the more credit card debt a person usually has.
However, when you look at the payment data, consumers who earn $100,000+ tend to have a similar minimum monthly payment. This is because credit card companies only require you to pay a percentage of the total you owe every month. So while the higher income brackets may have more debt, the percentage they owe on that debt may be smaller. Credit card companies do this because they make money on the interest a consumer pays after not paying off their credit card debt in full each month.
It’s also interesting to note that only 70.59% consumers who make below $30,000 have a credit card. The number of people who own a credit card jumps nearly 18% in the next income bracket ($30,000-$60,000).

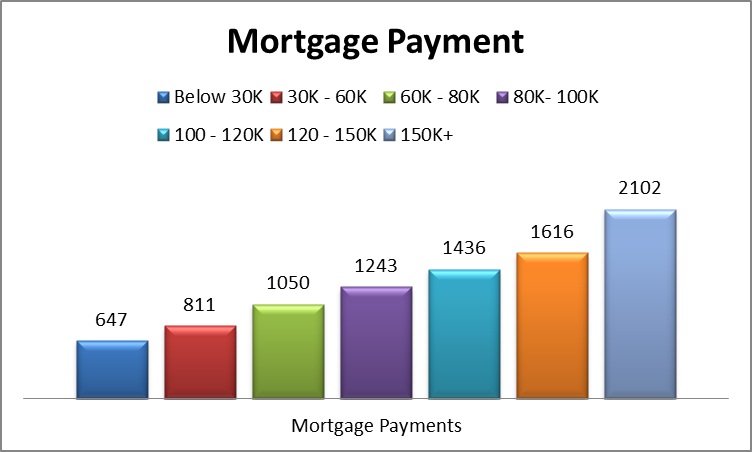
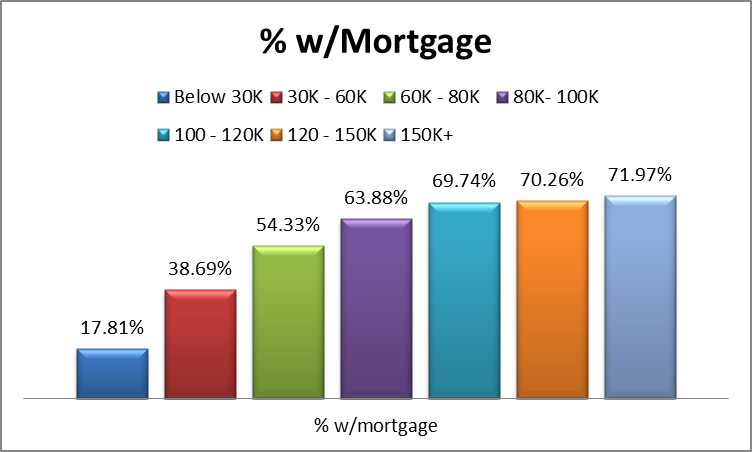
Mortgage
Again, consumers who have higher incomes are more likely to have more mortgage debt and higher monthly payments. This is because consumers in higher income brackets have more access to credit and can qualify to buy more expensive houses.
On the flip side, consumers who earn less than $60,000 are also significantly less likely to own a home. Only 17.81% of consumers who make less than $30,000 have a mortgage while consumers who make between $30,000-$60,000 are only 38.69% likely to own a home. When you look at higher income brackets, the likelihood of a consumer having a mortgage increases to above 60%.
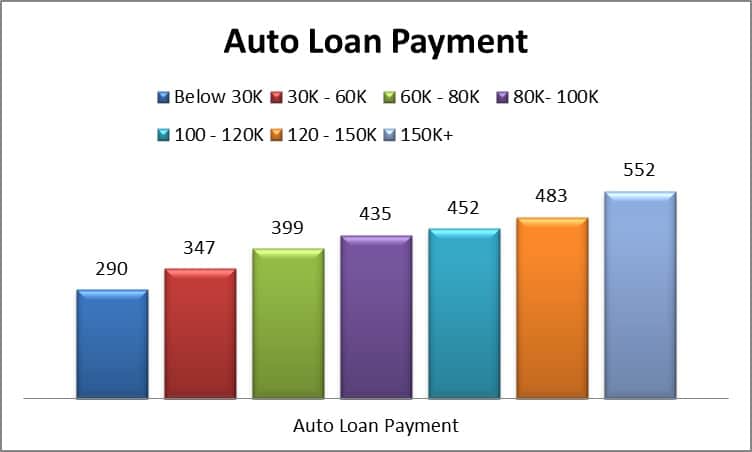
Auto Loans
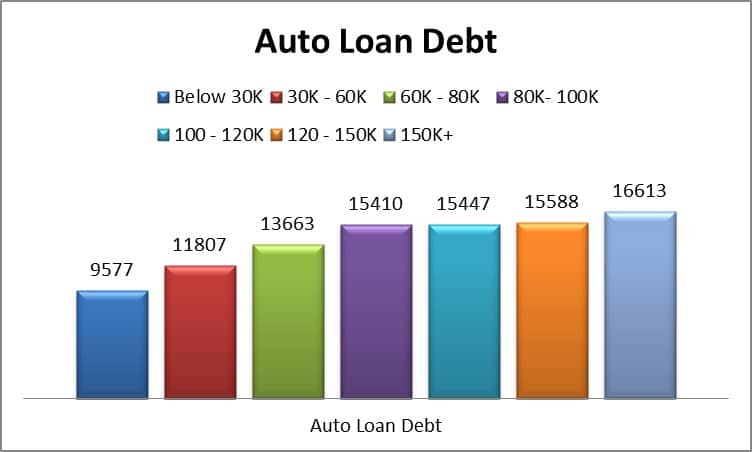
Auto loan payments and debt have a very similar trend to mortgages and credit cards. The more income you make, the higher your monthly payment and debt amount tends to be.
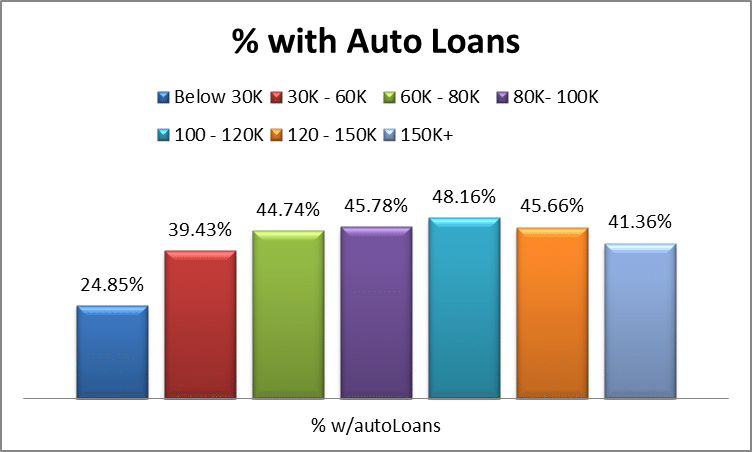
However, the trend in the percentage of people who have an auto loan differs from mortgage and credit card trends, which increases with income. The percentage of consumers who have an auto loan remains relatively consistent once you make more than $30,000 per year.
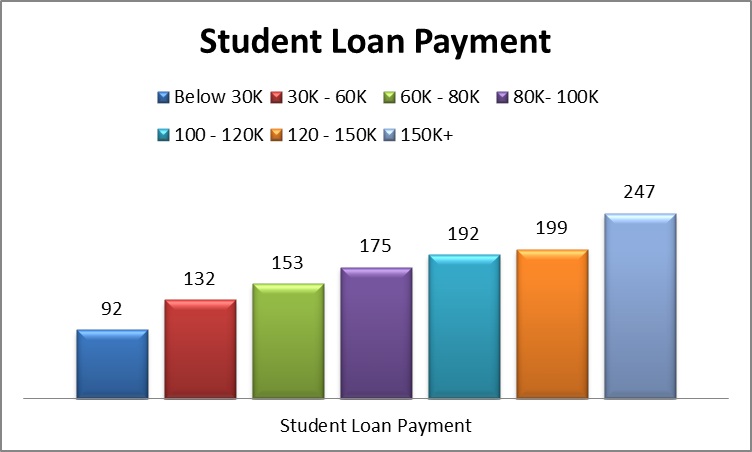
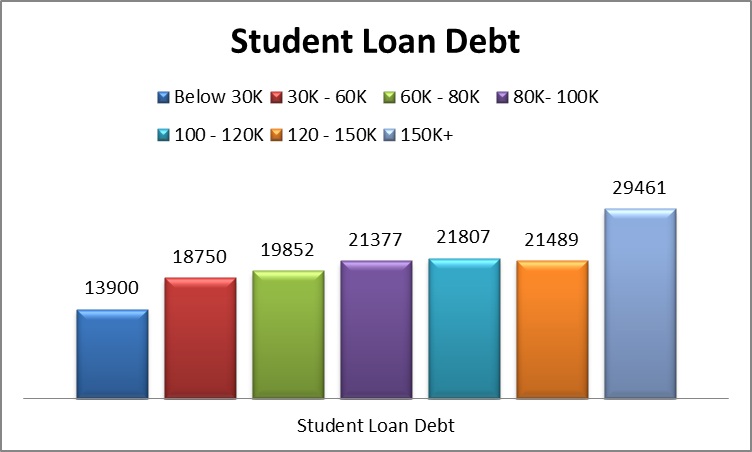
Student Loans
The amount of student loan debt is fairly consistent across all income groups, with the exception of those who earn below $30,000 (student debt is $13,900) and those who earn more than $150,000 (student debt is $29,461). This could be because people who earn below $30,000 may have attended a trade school and thus have less student debt whereas someone who earns more than $150,000 may have chosen a profession that requires a higher level of schooling (lawyer, doctor, etc.).
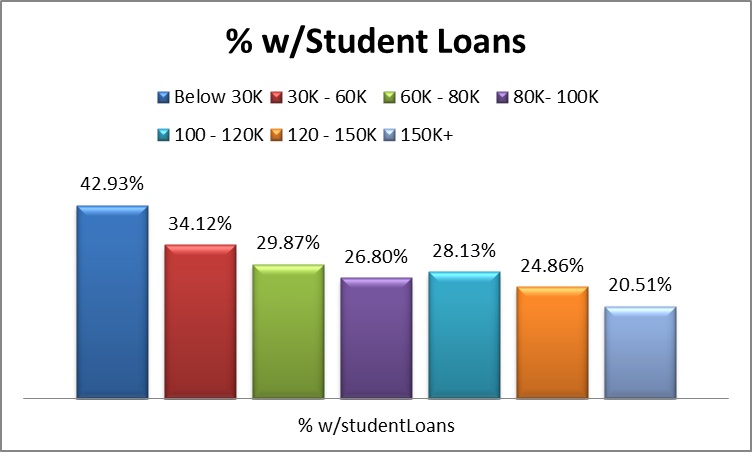
The percentage of consumers with student loans tapers off once you get into the higher income brackets. This is likely due to the fact that consumers who make more money have been in the workplace longer and have had more time to pay off their student loan debt.
Methodology
Credit Sesame’s social comparison reports are based on credit files of the Credit Sesame user base pulled in the months of July and August of 2012 and user-reported data. Data is screened for completeness and statistically weighted to reflect national income distributions as reported by the U.S. Census Bureau and the Department of Labor, as well as the latest credit score distribution reported by FICO, Inc. This report includes 295,288 samples.
Payment definition – the amount of money that you need to pay each month in order to remain current on your debt
About Credit Sesame
Credit Sesame is the best free way to see your monthly credit score and act on it. Its proprietary algorithm monitors the market, analyzes consumers’ current credit profiles and provides them with 100 percent unbiased recommendations on their mortgage, credit cards and personal loans so that consumers can act smarter on their credit and save money. The company was founded in 2010 and is based in Sunnyvale, California.
For more information visit www.creditsesame.com.
Contact:
Credit Sesame
media_pr@creditsesame.com
Phone: 650.273.4366