Credit Sesame discusses U.S. wealth and borrowing and why some Americans are more in debt than ever.
Conflicting financial data can be a real head-scratcher. A mid-March 2024 report from the Federal Reserve showed that household net worth had reached an all-time high. The same report showed that household debt was also at a record high. This seems like a contradiction: Americans are wealthier than ever before yet owe more money than ever before.
The key to understanding that contradiction is recognizing that the data represents two types of people: net savers and net borrowers. Not only are these two groups in very different financial shape, but conditions recently have shifted decidedly in favor of one group over the other.
Wealth and borrowing are at record levels
One way to understand the apparent contradiction is to consider the various data points separately. Since the Great Recession ended in 2009, total U.S. household wealth has risen steadily to an all-time high of $156 trillion.
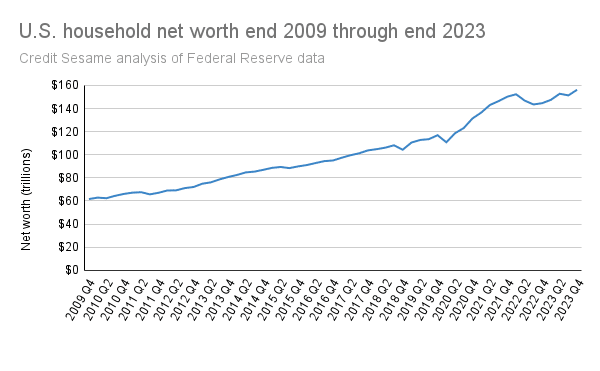
The chart shows that from the end of 2009 through the end of 2023, U.S. household net worth rose from $61.6 trillion to $156.2 trillion. It’s been a reasonably smooth ride, with just a few minor hiccups. The latest setback was in 2022, but household wealth shook off that setback and rose to new heights in 2023. This progress was thanks to strong asset growth.
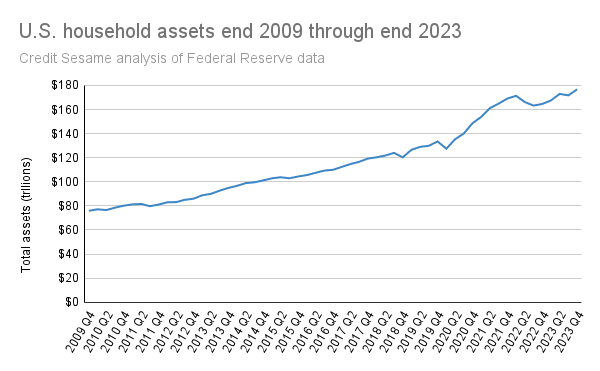
From the end of 2009 through the end of 2023, the value of household assets grew from just under $76 trillion to $176.7 trillion. Net worth is calculated by subtracting liabilities from assets. Liabilities have grown even as assets have soared:
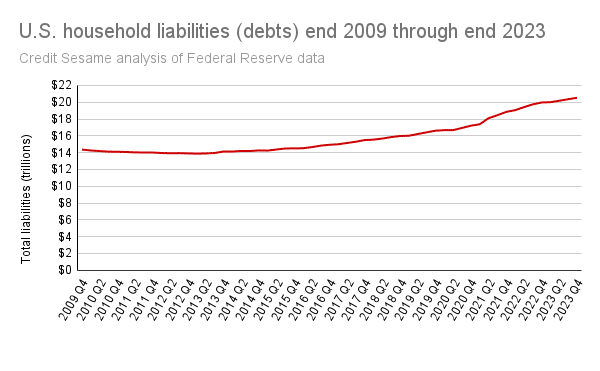
That period from the end of 2009 through the end of last year also showed persistent growth in household liabilities, which include various forms of debt. The pace of this growth has picked up over the past three years, bringing household debt to a record high of $20.5 trillion.
One explanation for why both assets and debt have grown so consistently over this period is that it was a great time for investment returns and a great time to borrow money. Different households embraced one or the other of those two experiences.
2010 to 2021 was a great time to borrow
First, let’s look at why so many households found borrowing money so attractive in the period following the Great Recession from mid-2009.
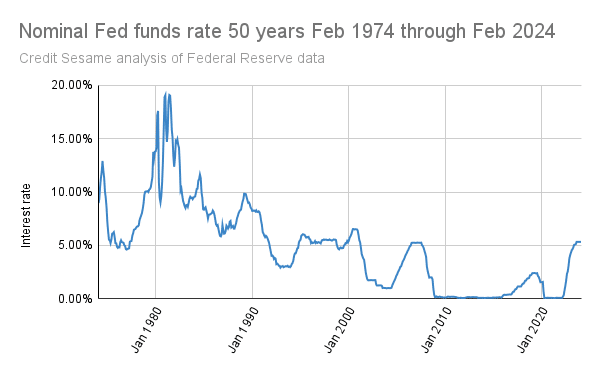
The above chart shows the Fed funds rate over the past 50 years. Since interest rates represent the cost of borrowing money, this chart can give you some idea of when borrowing has been expensive and when it’s been cheap. Over the past 50 years, the Fed funds rate has averaged 4.8%. However, in the aftermath of the Great Recession, it plunged to nearly zero—and stayed there until 2022.
While interest rates like credit card APRs and mortgages vary, the Fed funds rate gives a general idea of interest rate trends. What this chart shows is that from roughly 2010 through 2021, borrowing was unusually cheap. In effect, people were strongly encouraged to borrow during that period.
Stocks and real estate have provided strong asset returns
The flip side of low interest rates is that they are not very rewarding to people with traditional deposit products like savings accounts and CDs. These people earned very little return on their savings from 2010 to 2021, often not even enough to keep up with inflation.
On the other hand, though, the period following the Great Recession has been very good for real estate and stock market returns. Since the end of 2009, home prices nationally have more than doubled. The value of the S&P 500 has more than quadrupled.
Rates returned to normal last year, but borrowing kept on growing
In short, since the Great Recession, the U.S. has seen an extended period when borrowing was unusually cheap. That helps explain the record amount of debt American households amassed. The same period saw unusually strong growth in asset values, which explains why net worth has reached a record high. This isn’t so much a contraction as it is a view of two distinctly different types of financial behavior.
While many households have assets and liabilities, what matters is net worth, whether they have significantly more assets than liabilities or vice versa. While borrowing was unusually attractive for many years, that has now changed. The last few years saw the Fed funds rate rise to 5.33%, about half a percent above its 50-year average.
Most of the years since the Great Recession featured extremely low interest rates that encouraged record borrowing. Those same low rates punished savers in traditional deposit accounts, helping to push money into investments. This helped boost stock and real estate values.
Now that interest rates are higher, savers who invested in stocks and real estate still benefit from high asset values. For heavy borrowers, though, the script has flipped. The super-low interest rates are gone, leaving many in debt for extended periods.
If you enjoyed Americans are wealthier and more in debt than ever you may like,
- Americans say they would prioritize saving and debt reduction
- U.S. national debt in the spotlight in January 2024
Disclaimer: The article and information provided here is for informational purposes only and is not intended as a substitute for professional advice.