
Being that millennials now make up America’s largest generation, what these young adults choose to do with their money is a hot topic of conversation. A report by Fidelity Investments that suggested 35-year-olds should have twice their salary saved prompted outrage on Twitter from a crowd of angry (and presumably financially-strapped) millennials. On the other hand, it’s been reported that millennials are generally good at saving, but bad at investing. And of course, there’s the infamous avocado toast hypothesis, in which millionaire Tim Gurner asserted that millennials would be in better positions to buy homes if they stopped buying $19 smashed avocados and $4 coffees.
In order to take a more objective look at where millennials are putting their hard-earned dollars and how that compares to previous generations, researchers at Credit Sesame, an online credit management platform, analyzed current and historical data from the Federal Reserve Survey of Consumer Finances. Specifically, Credit Sesame looked at how millennial household finances in 2016 compared to those of Generation X in 2001 (when Gen Xers were the same age as millennials in 2016). For the purposes of this study, millennial households are defined as those with a head of household between the ages of 20 and 35 in 2016, while Generation X households are defined as those with a head of household between the ages of 20 and 35 in 2001. All dollar amounts presented are inflation adjusted to 2016. Here’s what Credit Sesame found:
Takeaways:
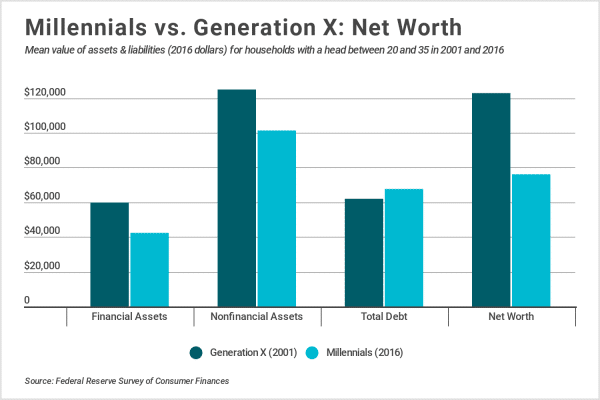
- Compared to Generation X households, millennial households held approximately 30 percent less value in financial assets. The decline was largely the result of millennials holding less value in stocks and cash value life insurance.
- In 2016, millennial households held 19 percent less value in nonfinancial assets than did Generation X households in 2001. Most of the reduction occurred as a result of millennials holding less business equity than Gen Xers, but declining homeownership was also a factor.
- Millennials held slightly more debt than Generation X ($67,635 vs. $62,025). While millennials held less mortgage and credit card debt, mounting student loan debt more than offset those differences.
- Overall, the average net worth of millennial households was 38 percent lower than that of the preceding generation at the same age. The average net worth for millennial households was $76,100 in 2016 compared to $122,900 in 2001 for Generation X.
For a more in-depth look at how millennials compare to Generation X across their financial assets, nonfinancial assets, and debt, continue reading below.
Millennial vs. Generation X Financial Assets
1. Transaction accounts
- Average value (all millennials): $9,379
- Average value (millennials w/ holdings): $9,600
- Percent of millennials w/ holdings: 97.7%
- Average value (all Gen X): $7,752
- Average value (Gen X w/ holdings): $8,900
- Percent of Gen X w/ holdings: 87.1%
Transaction accounts, including checking, savings, money market, call accounts, and prepaid debit cards, were the most commonly held financial asset across both generations. In 2016, 97.7 percent of millennials held some form of transaction account, which is more than 10 percentage points higher than that of Generation X. In addition to a greater proportion of millennials holding transaction accounts, the average value of those accounts was also greater than those held by Gen Xers in 2001.
Photo Credit: Credit Sesame
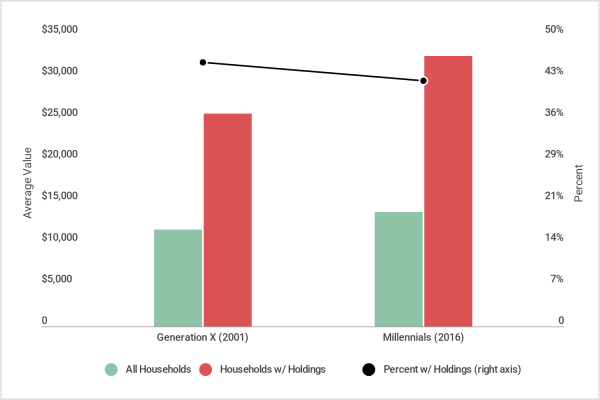
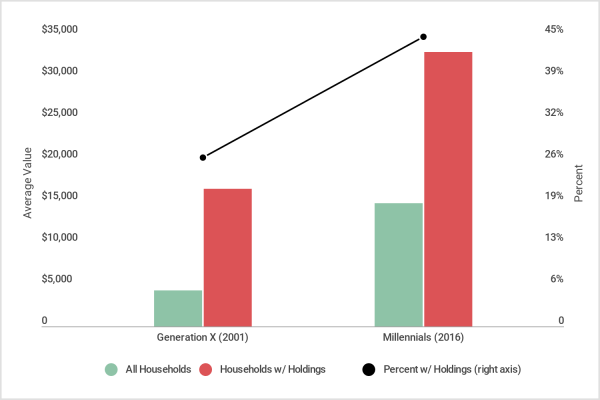
2. Retirement accounts
- Average value (all millennials): $13,715
- Average value (millennials w/ holdings): $32,500
- Percent of millennials w/ holdings: 42.2%
- Average value (all Gen X): $11,597
- Average value (Gen X w/ holdings): $25,600
- Percent of Gen X w/ holdings: 45.3%
Retirement accounts include individual retirement accounts (IRAs), pensions, Keogh accounts, and certain employer-sponsored accounts, such as 401(k), 403(b), and thrift savings accounts. They are the second most common financial asset across both generations. In 2016, 42.2 percent of millennials held some form of retirement account, which is slightly lower than the 45.3 percent of Gen Xers who held retirement accounts in 2001. That said, millennials who are saving for retirement appear to be saving more than their age cohort did in 2001. In 2016, millennials with retirement accounts held an average of $32,500 in those accounts, while Gen Xers held just $25,600 15 years prior. As a result, the average value of retirement accounts across all millennial households was more than $2,000 higher than that of Gen X households.
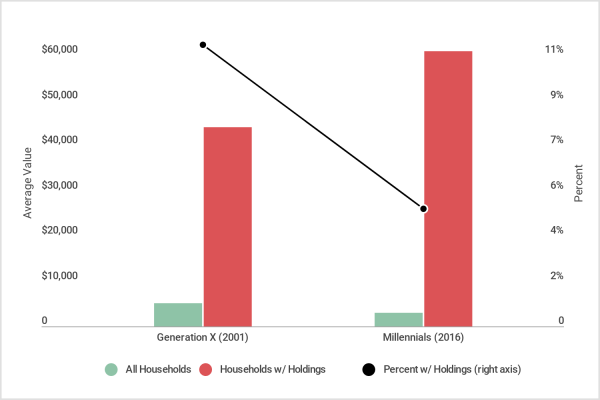
3. Stocks
- Average value (all millennials): $4,240
- Average value (millennials w/ holdings): $42,400
- Percent of millennials w/ holdings: 10.0%
- Average value (all Gen X): $15,260
- Average value (Gen X w/ holdings): $87,700
- Percent of Gen X w/ holdings: 17.4%
This category refers to publicly traded stocks that are directly held (e.g. not held as part of managed investment accounts or mutual funds). In 2001, over 17 percent of young households directly held stocks; that number declined to just 10 percent by 2016. Millennials, many of whom fear another Great Recession, are putting less money in stocks than previous generations, and more in “safe” vehicles like transaction accounts. While less risky, their resistance to the stock market could ultimately cost millennial households millions in retirement savings as they miss out on the power of compounding interest.
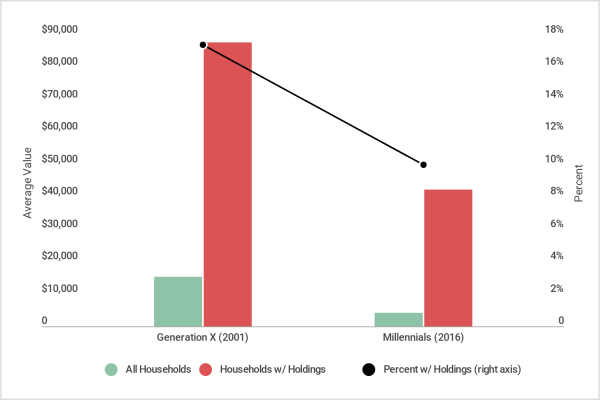
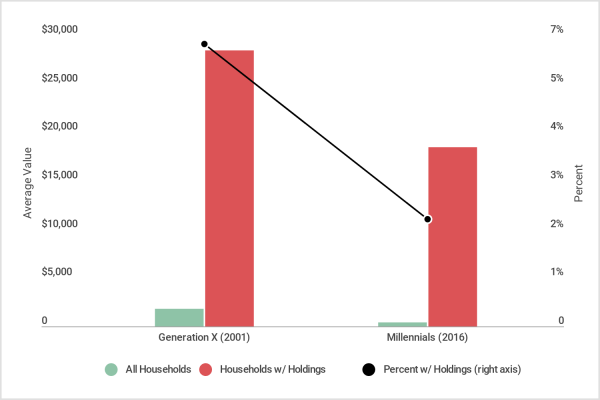
4. Cash value life insurance
- Average value (all millennials): $884
- Average value (millennials w/ holdings): $9,500
- Percent of millennials w/ holdings: 9.3%
- Average value (all Gen X): $9,300
- Average value (Gen X w/ holdings): $62,000
- Percent of Gen X w/ holdings: 15.0%
Cash value life insurance, also known as permanent life insurance, is a form of life insurance with a cash savings component. Examples of cash value life insurance include universal life, whole life, and variable life insurance. Unlike term life insurance policies, cash value policies provide lifelong coverage for the policyholder and typically have higher premiums. As a generation, millennials have pushed back major life events like buying a home, getting married, and having children. As a result, the need for financial protection against loss of earnings is less common among millennials than previous generations. Roughly one-third fewer young households held cash value life insurance in 2016 than in 2001. Additionally, millennial households with cash value life insurance had markedly lower balances than Generation X. These trends could be the result of more people choosing term life insurance policies over cash value policies, or people foregoing life insurance altogether.
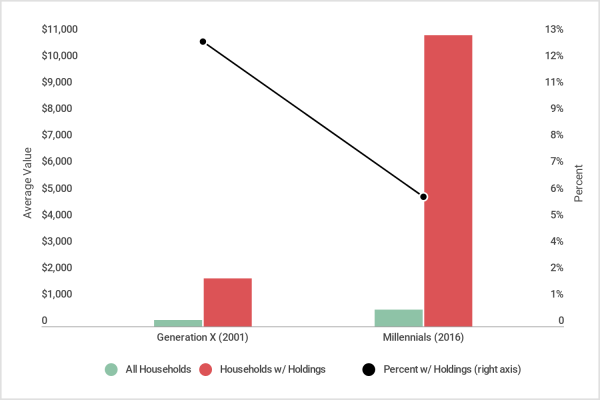
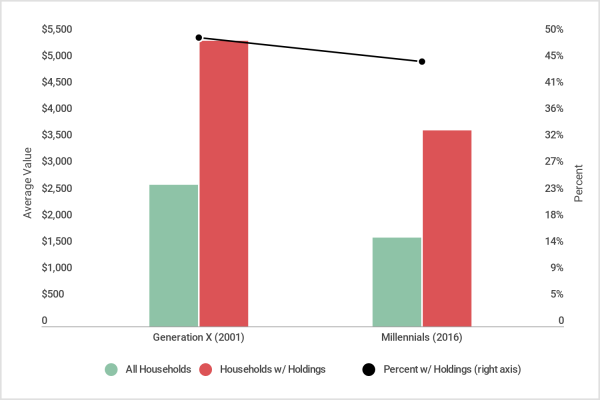
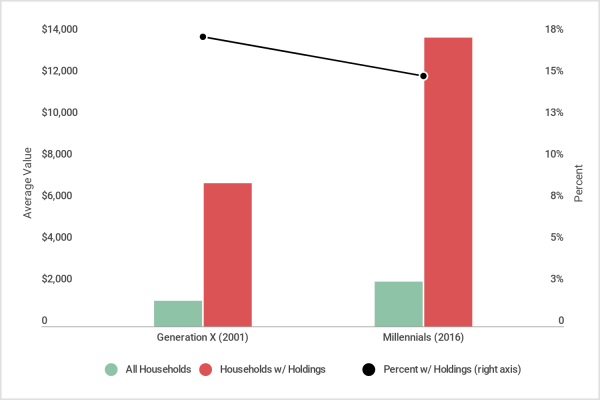
5. Savings bonds
- Average value (all millennials): $638
- Average value (millennials w/ holdings): $11,000
- Percent of millennials w/ holdings: 5.8%
- Average value (all Gen X): $229
- Average value (Gen X w/ holdings): $1,800
- Percent of Gen X w/ holdings: 12.7%
Frequently given out as gifts to newborns, graduates, and newlyweds, savings bonds were once one of America’s safest and most popular investment vehicles. However, a combination of low interest rates and the elimination of paper bonds has made these investments increasingly unpopular. Between 2001 and 2016 the ownership rate for savings bonds dropped from 12.7 percent to 5.8 percent. That said, millennials households with savings bonds held substantially more value in those bonds than Generation X households.
6. Pooled investment funds
- Average value (all millennials): $2,928
- Average value (millennials w/ holdings): $61,000
- Percent of millennials w/ holdings: 4.8%
- Average value (all Gen X): $5,072
- Average value (Gen X w/ holdings): $44,100
- Percent of Gen X w/ holdings: 11.5%
Pooled investment funds include all types of directly held pooled investments, such as stock funds, bond funds, mutual funds, exchange-traded funds (ETFs), real estate investment funds, and hedge funds. Pooled investment funds do not include money market funds or indirectly held mutual funds. The number of young households with pooled investment funds declined by more than 50 percent between 2001 and 2016, further demonstrating millennials’ general aversion to the stock market. However, unlike what’s been observed for directly held stocks, millennial households with pooled investment funds hold significantly more money in those funds than Generation X did. WIth regards to pooled investment funds, fewer households held more wealth.
7. Certificates of deposit
- Average value (all millennials): $444
- Average value (millennials w/ holdings): $18,500
- Percent of millennials w/ holdings: 2.4%
- Average value (all Gen X): $1,789
- Average value (Gen X w/ holdings): $28,400
- Percent of Gen X w/ holdings: 6.3%
Certificates of deposit (CDs) are accounts held for a set period of time that must be renewed or cashed when they mature. While an uncommon financial asset across both generations, CDs were even less popular among millennial households. Similar to what was observed for savings bonds, the ownership rate of certificates of deposit declined from 6.3 percent for Generation X to 2.4 percent for millennials. That said, CD ownership across all ages groups has declined since the late-2000s as a result of low interest rates, which make CDs less advantageous over transaction accounts.
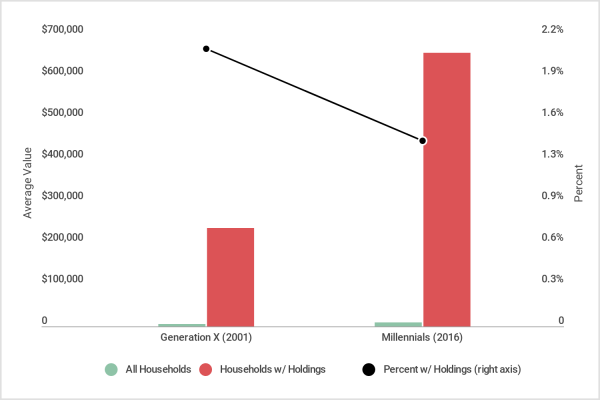
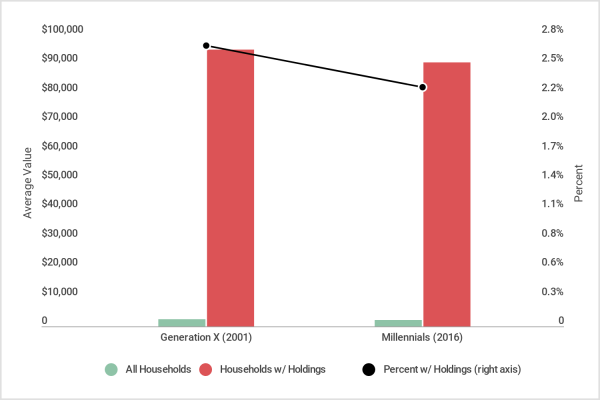
8. Other managed assets
- Average value (all millennials): $9,198
- Average value (millennials w/ holdings): $657,000
- Percent of millennials w/ holdings: 1.4%
- Average value (all Gen X): $4,954
- Average value (Gen X w/ holdings): $235,900
- Percent of Gen X w/ holdings: 2.1%
Other managed assets include personal annuities with an equity interest, trusts with an equity interest, and managed investment accounts (typically managed by a professional). These types of financial assets are most common among high-net-worth individuals, as evident by the data above. For young households, ownership of these types of financial assets declined slightly between 2001 and 2016. However, the average asset value for households with holdings increased by almost 200 percent. In other words, fewer households held substantially more wealth.
Millennial vs. Generation X Non-financial Assets
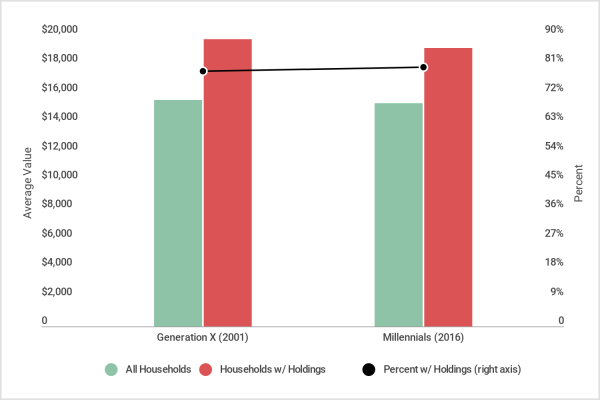
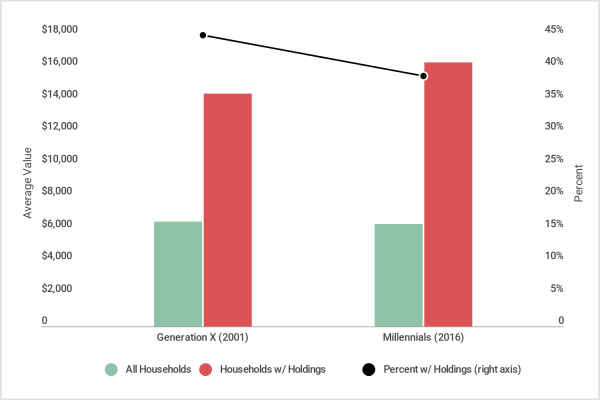
1. Vehicles
- Average value (all millennials): $15,318
- Average value (millennials w/ holdings): $19,100
- Percent of millennials w/ holdings: 80.2%
- Average value (all Gen X): $15,524
- Average value (Gen X w/ holdings): $19,700
- Percent of Gen X w/ holdings: 78.8%
Vehicles were the most commonly held nonfinancial asset for both generations. This category is broad, covering everything from cars and RVs to boats, airplanes, and helicopters. Over 80 percent of millennial households owned a vehicle in 2016, a number that’s just slightly higher than the ownership rate among Generation X in 2001. Interestingly, while home prices (and their corresponding household asset values) have been increasing, the average value of vehicles stayed relatively consistent between 2001 and 2016.
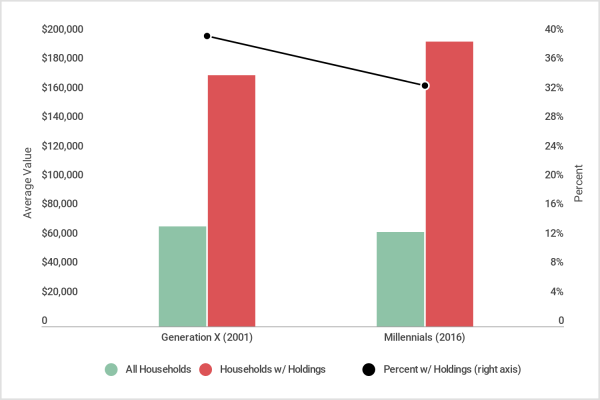
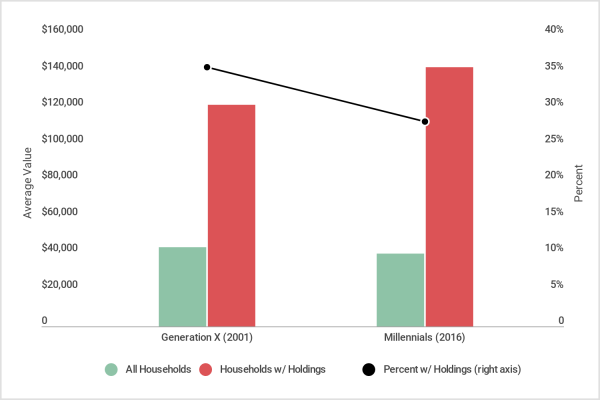
2. Primary residence
- Average value (all millennials): $64,677
- Average value (millennials w/ holdings): $195,400
- Percent of millennials w/ holdings: 33.1%
- Average value (all Gen X): $68,947
- Average value (Gen X w/ holdings): $172,800
- Percent of Gen X w/ holdings: 39.9%
Between the turn of the century and 2016, the U.S. saw steep declines in homeownership and sharp increases in the price of homes. Comparing millennials to Generation X across all families, the average primary residence asset value is only a few percentage points different. However, the similarity results from fewer millennials owning more expensive homes. In 2016, only 33.1 percent of millennials held home equity, compared to 39.9 percent of Gen Xers in 2001. But millennials with home equity held $22,600 more than Generation X did ($195,400 vs. $172,800).
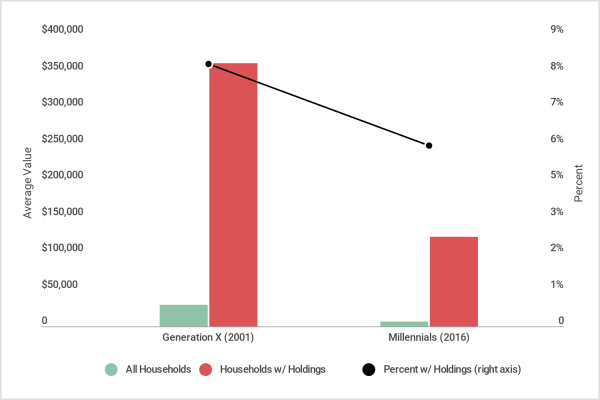
3. Business equity
- Average value (all millennials): $6,894
- Average value (millennials w/ holdings): $123,100
- Percent of millennials w/ holdings: 5.6%
- Average value (all Gen X): $29,241
- Average value (Gen X w/ holdings): $361,000
- Percent of Gen X w/ holdings: 8.1%
Entrepreneurship plays a vital role in the U.S. economy, with new businesses responsible for millions of added jobs each year. The business equity asset category includes ownership in all types of private businesses (often startups), including sole proprietorships, partnerships, limited liability companies, S corporations, and other non-publicly-traded types of corporations. In 2016, 30 percent fewer millennial households held an equity stake in a private company than Generation X households did 15 years prior. Additionally, the average value of millennials’ business equity was less than half of what it was in 2001. This decline parallels a similar drop in new business creation during that time period, which has economists worrying about the future of American entrepreneurism.
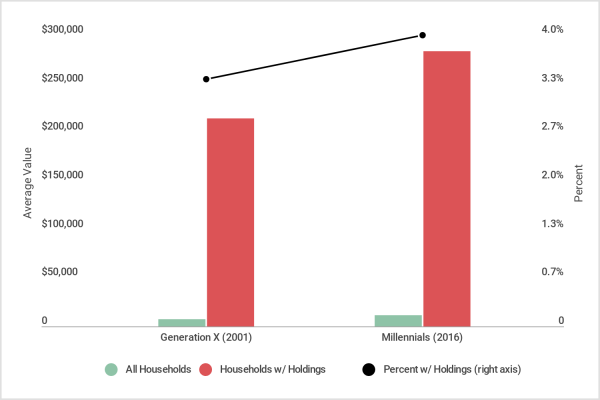
4. Other residential property
- Average value (all millennials): $11,352
- Average value (millennials w/ holdings): $283,800
- Percent of millennials w/ holdings: 4.0%
- Average value (all Gen X): $7,279
- Average value (Gen X w/ holdings): $214,100
- Percent of Gen X w/ holdings: 3.4%
Other residential property (not the primary residence) includes second homes, timeshares, small rental properties (one to four families), and other types of residential properties. This category also includes outstanding balances on any loans given by, and still owed to, the family to finance the sale(s) of previously owned properties. The ownership rate of other residential property was similar among millennials and Generation X, but the average value for households with holdings increased by $69,700. This increase in value for households with holdings is inline with increasing residential real estate prices.
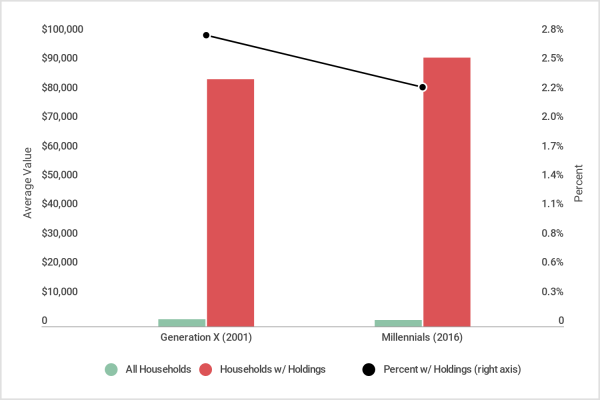
5. Equity in nonresidential property
- Average value (all millennials): $2,121
- Average value (millennials w/ holdings): $92,200
- Percent of millennials w/ holdings: 2.3%
- Average value (all Gen X): $2,377
- Average value (Gen X w/ holdings): $84,900
- Percent of Gen X w/ holdings: 2.8%
Nonresidential property was the least common nonfinancial asset across both generations, with ownership rates of just 2.3 percent for millennials and 2.8 percent for Gen Xers. This category only includes nonresidential property that’s not owned through a business, such as commercial property, large rental property (with five or more units), farm and ranch land, and undeveloped land. While not owned through a business, most nonresidential real estate properties function similarly to a business. For example, they might be owned by multiple owners and have sizeable mortgages that are paid for by the revenue that the property generates. Equity in this uncommon asset has stayed fairly consistent from 2001 to 2016.
Millennial vs. Generation X Debt
1. Credit cards
- Average value (all millennials): $1,680
- Average value (millennials w/ holdings): $3,700
- Percent of millennials w/ holdings: 45.4%
- Average value (all Gen X): $2,678
- Average value (Gen X w/ holdings): $5,400
- Percent of Gen X w/ holdings: 49.6%
While student loan debt seems to get most of the attention with regards to millennial finances, millennial households are actually more likely to have credit card debt than any other form of debt. Luckily, the average debt amount is far lower than that of education loans. Compared to Generation X, millennial households were less likely to have credit card debt (45.4 percent vs. 49.6 percent). Millennial households with debt also held roughly 30 percent less debt.
2. Education loans
- Average value (all millennials): $14,784
- Average value (millennials w/ holdings): $33,000
- Percent of millennials w/ holdings: 44.8%
- Average value (all Gen X): $4,307
- Average value (Gen X w/ holdings): $16,500
- Percent of Gen X w/ holdings: 26.1%
According to the Bureau of Labor Statistics, millennials have higher educational attainment than any preceding generation. Nearly 75 percent of millennials have attended college, compared with 67 percent of Gen Xers. Interestingly, millennials have pursued more education despite its rising cost, which is why not only did more millennial households have student loan debt (44.8 percent vs. 26.1 percent), but the average value of that debt was twice as high.
3. Vehicle loans
- Average value (all millennials): $6,308
- Average value (millennials w/ holdings): $16,300
- Percent of millennials w/ holdings: 38.7%
- Average value (all Gen X): $6,480
- Average value (Gen X w/ holdings): $14,400
- Percent of Gen X w/ holdings: 45.0%
Even though a slightly higher proportion of millennial households owned vehicles in 2016 than Gen X did in 2001, a smaller proportion of millennials held auto loan debt. While ownership of vehicles across the two generations is similar, Generation X households were much more likely to take out loans to finance their vehicle purchases.
4. Mortgages
- Average value (all millennials): $39,958
- Average value (millennials w/ holdings): $142,200
- Percent of millennials w/ holdings: 28.1%
- Average value (all Gen X): $43,325
- Average value (Gen X w/ holdings): $121,700
- Percent of Gen X w/ holdings: 35.6%
The statistics for mortgage debt mirror those for primary residence equity. As with primary residences, fewer millennials held mortgage debt than did Generation X, but the average debt for millennials with a mortgage was higher. This reflects lower homeownership rates and higher home prices comparing 2001 to 2016.
5. Other installment loans
- Average value (all millennials): $2,155
- Average value (millennials w/ holdings): $13,900
- Percent of millennials w/ holdings: 15.5%
- Average value (all Gen X): $1,235
- Average value (Gen X w/ holdings): $6,900
- Percent of Gen X w/ holdings: 17.9%
Installment loans are consumer loans that typically have fixed payments and a fixed term. The most common examples of installment loans are auto loans and student loans (not included in this category); however, consumers can take out installment loans to finance other purchases like furniture, appliances, and other durable goods. These “other installment loans” were held by 15.5 percent of millennial households in 2016, a slight decrease from Gen X’s 17.9 percent. However, the millennial households with installment loan debt held more than twice as much debt ($13,900 vs. $6,900). As a result, across all households, millennials held roughly 75 percent more installment loan debt.
6. Other home-secured debt
- Average value (all millennials): $2,086
- Average value (millennials w/ holdings): $90,700
- Percent of millennials w/ holdings: 2.3%
- Average value (all Gen X): $2,565
- Average value (Gen X w/ holdings): $95,000
- Percent of Gen X w/ holdings: 2.7%
Other home-secured debt includes all loans in which the borrower uses his or her home as collateral to secure the loan. Also known as home equity loans, these loans allow homeowners to fairly easily borrow large amounts of money at low rates. While uncommon across both generations, the average debt amount for those holding debt was close to six figures. Mirroring the decline in homeownership, there was also a decline in home-secured debt between 2001 and 2016.
Methodology
The data used in this analysis is from the Federal Reserve 2016 Survey of Consumer Finances (SCF), the most recent survey available. Millennial households are defined as those with a head of household between the ages of 20 and 35 in 2016. Generation X households are defined as those with a head of household between the ages of 20 and 35 in 2001. This selection criteria is the best option given the availability of data from the SCF, which is released once every three years. The “all household” values were calculated based on mean values for households with holdings and the proportion of households with holdings, both provided by the SCF. Only categories with “all household” values above $500 for either generation were included. Categories are ordered by the percent of millennial households with holdings.