Credit Sesame takes a look at the housing market, slowing sales and what this means for house buyers and seller.
If you’ve been thinking of buying a home, you’re probably all too aware that it’s been a seller’s market. Home prices have been soaring since late 2020. However, recently released data suggest the tide may be about to turn in favor of buyers.
A closer look at some of the trends surrounding home prices may help potential buyers take full advantage of market developments.
Home Prices Have Been on a Tear
Home prices tend to rise over time, but they’ve climbed at an unusually fast pace over the past year.
The graph below shows that the percentage change over the past twelve months has been about three times the average annual rate over the previous five years:

The data for the above price trend chart come from the S&P CoreLogic Case-Shiller National Home Price Index.
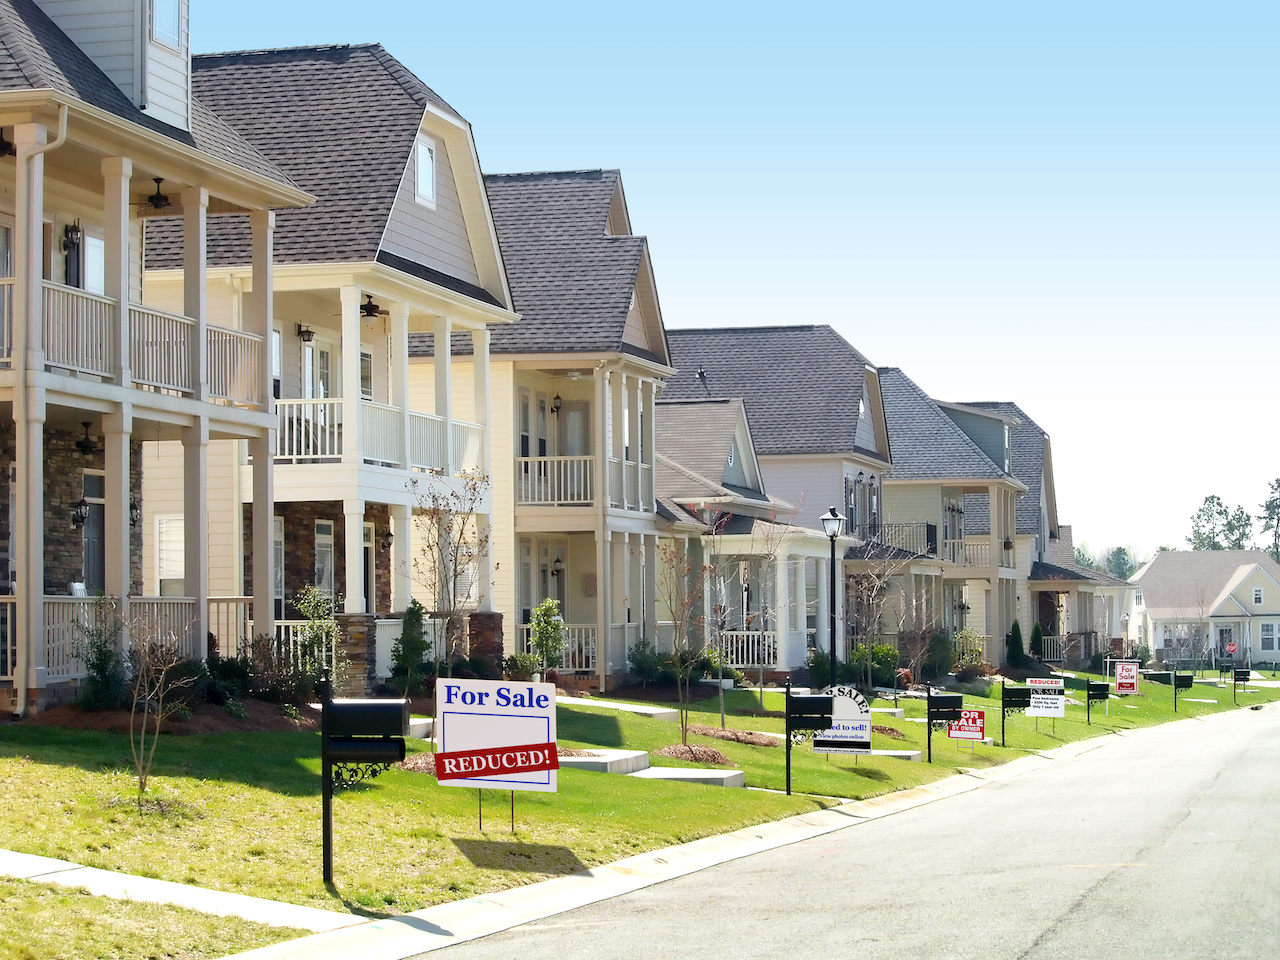
The numbers are reflected in anecdotal stories that have all the hallmarks of a hot real estate market. Would-be buyers are routinely having to submit bids over the seller’s asking price. Home owners whose properties are not on the market are getting cold calls from real estate agents asking if they’d consider selling.
Fast-rising home prices are very frustrating for buyers. They make trying to find an affordable home a moving target. By the time buyers figure out their budget and start their search, properties they might have considered a few months before have been priced out of their budget.
Sales Have Been Slowing So Far This Year
While prices have not yet eased, a recent report on new home sales suggests that they may be due to cool off.
A U.S. Census Bureau report on sales of newly-constructed home shows that the pace of home sales has slowed sharply in recent months.
New home sales peaked in December of 2021 at a seasonally-adjusted annual rate of 839,000 units. By April of 2022, new homes were selling at an annual pace of just 591,000.
[insert chart from New home sales volume tab of Home sales sheet]
That’s a drop of nearly 30% in just the first four months of this year. What’s more, the pace of that decline has accelerated. More than half of that percentage drop in volume occurred in April alone.
Market Forces Create Headwinds for Home Prices
Home prices are related to the market forces of supply and demand. Sharply-rising home prices may have discouraged some demand in recent months. Meanwhile, with fewer new homes being sold, the available supply has risen.
According to the Census Bureau report, at the end of 2021 the supply of new homes on the market was equal to 5.6 months’ worth of sales volume. By April of this year, 9 months’ worth of sales volume was available on the market.
That’s an increase of supply relative to demand of just over 60 percent.
There’s been a similar trend with respect to the supply and demand of existing homes for sale. Though the supply of homes for sale relative to demand is generally lower with existing homes than with new homes, this too has increased.
Existing home sale figures from the National Association of Realtors show this increase. From December to April, the ratio of supply relative to demand rose from 1.7 to 2.2, an increase of over 29%.
The growing ratio of homes for sale to demand should mean it will take longer for properties to sell. In time, this is likely to prompt sellers to lower their prices – or at least slow the pace of sale price increases.
An end to the frantic pace of home price increases seems inevitable given the headwinds facing that trend. For one thing, fast-rising prices eventually shut out some buyers. Also, as rising mortgage rates take up a greater share of buyer dollars, there is less left over to go towards home prices.
Keep an Eye on Regional Trends
As always with real estate, national trends may play out differently from one region to another.
For example, here’s how the sales volume of new homes has changed so far this year across four different regions, based on the Census Bureau Data.
[insert chart from Sales volume change by region tab of Home sales sheet]
This paints a very different picture of the real estate market depending on where you look. Home sales actually picked up in the Northeast over the first four months of this year. Meanwhile they declined in the other three regions.
Even more locally, changes in supply and demand will differ from city to city and even neighborhood to neighborhood. Home shoppers should keep an eye on local indicators like number of days on the market and sales price relative to asking price to guide their buying strategy.
What This Means for Buyers
In recent months, buyers have had two things going against them. Both rising prices and higher mortgage rates have made it more expensive to buy a home.
At least now, one of these trends may be poised to turn in favor of buyers. The slowing pace of home sales should help ease price increases, and may even lower prices in some markets.
As for higher mortgage rates, unfortunately as long as inflation remains high it will put upward pressure on those rates. Still, there are things home buyers can do to pay as low a rate as possible:
- Get your credit in shape. Check your credit report to see if there is room for improvement before applying for a mortgage. Consider signing up for credit monitoring to keep apprised of changes at this critical time.
- Shop around for mortgage rates. Mortgage lending is a competitive business, so there’s money to be saved by shopping around.
Mortgage and housing trends change all the time. For now, it looks like buyers may start to get a break after a stretch of fast-rising home prices.
Disclaimer: The article and information provided here is for informational purposes only and is not intended as a substitute for professional advice.