Sesame speaks
The company blog
- July 1, 2025
- •
- 3 min read
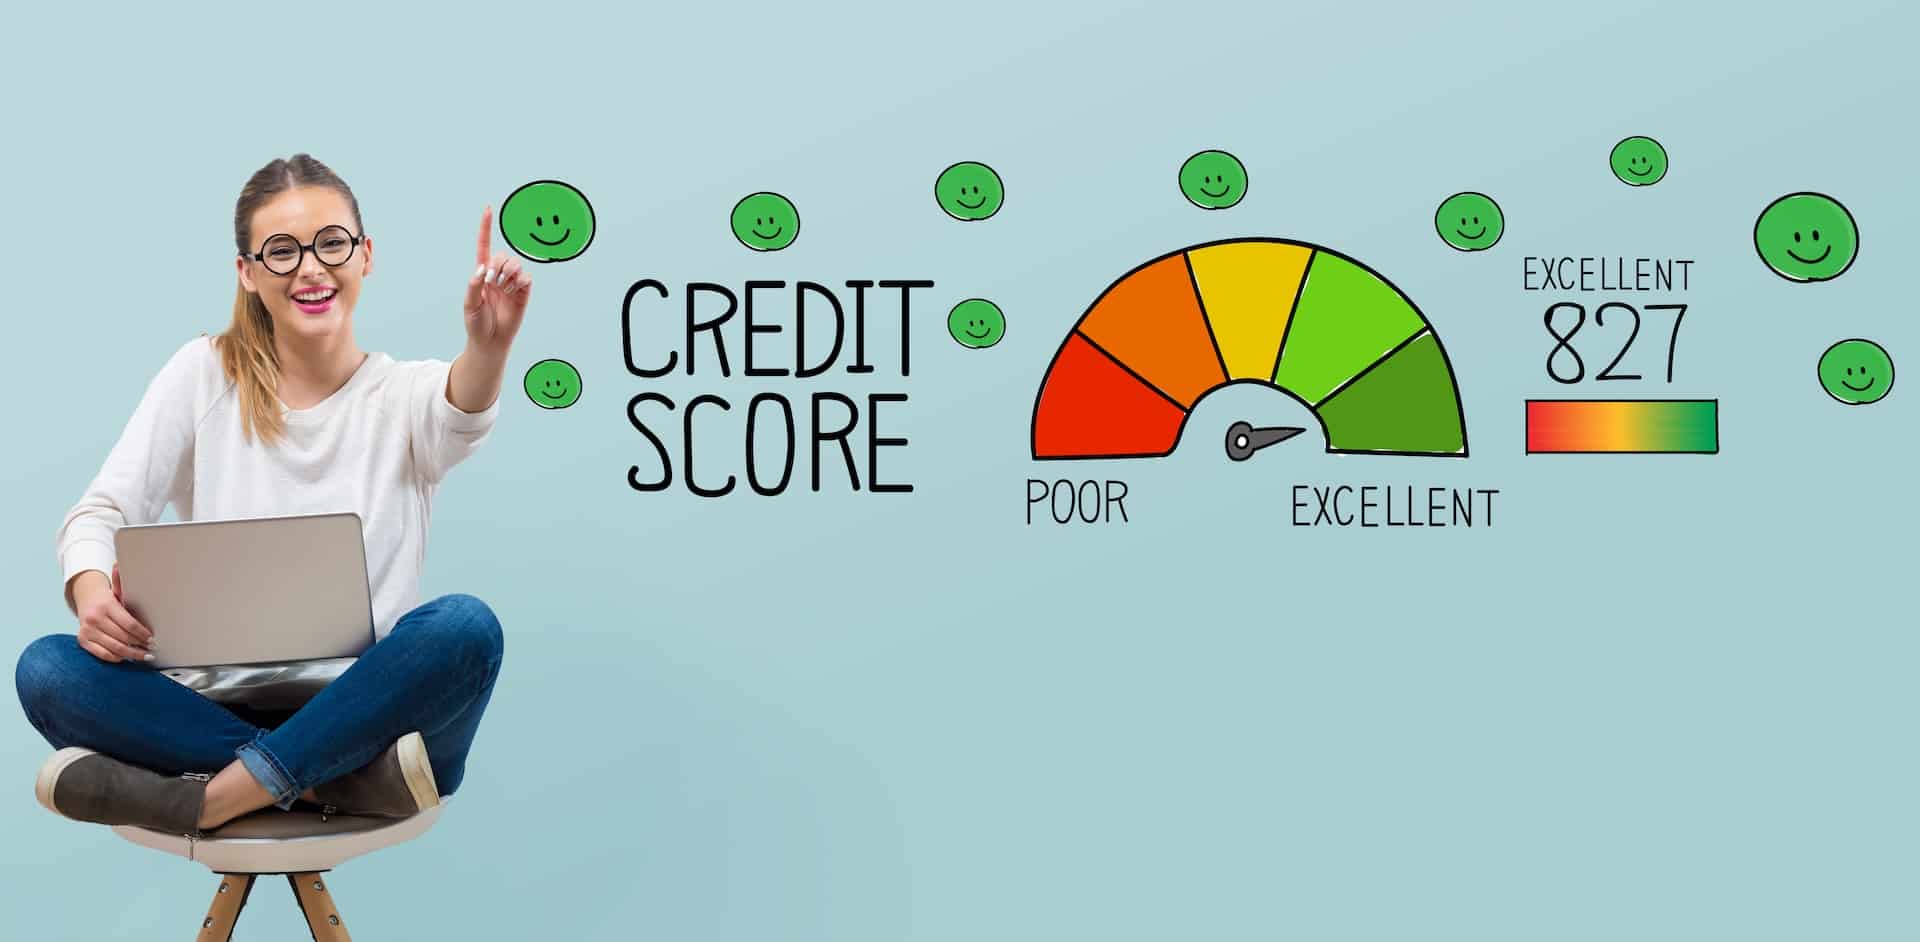
See your score right away and refresh it daily for free
Get the most complete view of your credit score for free
See the factors impacting your credit score for free

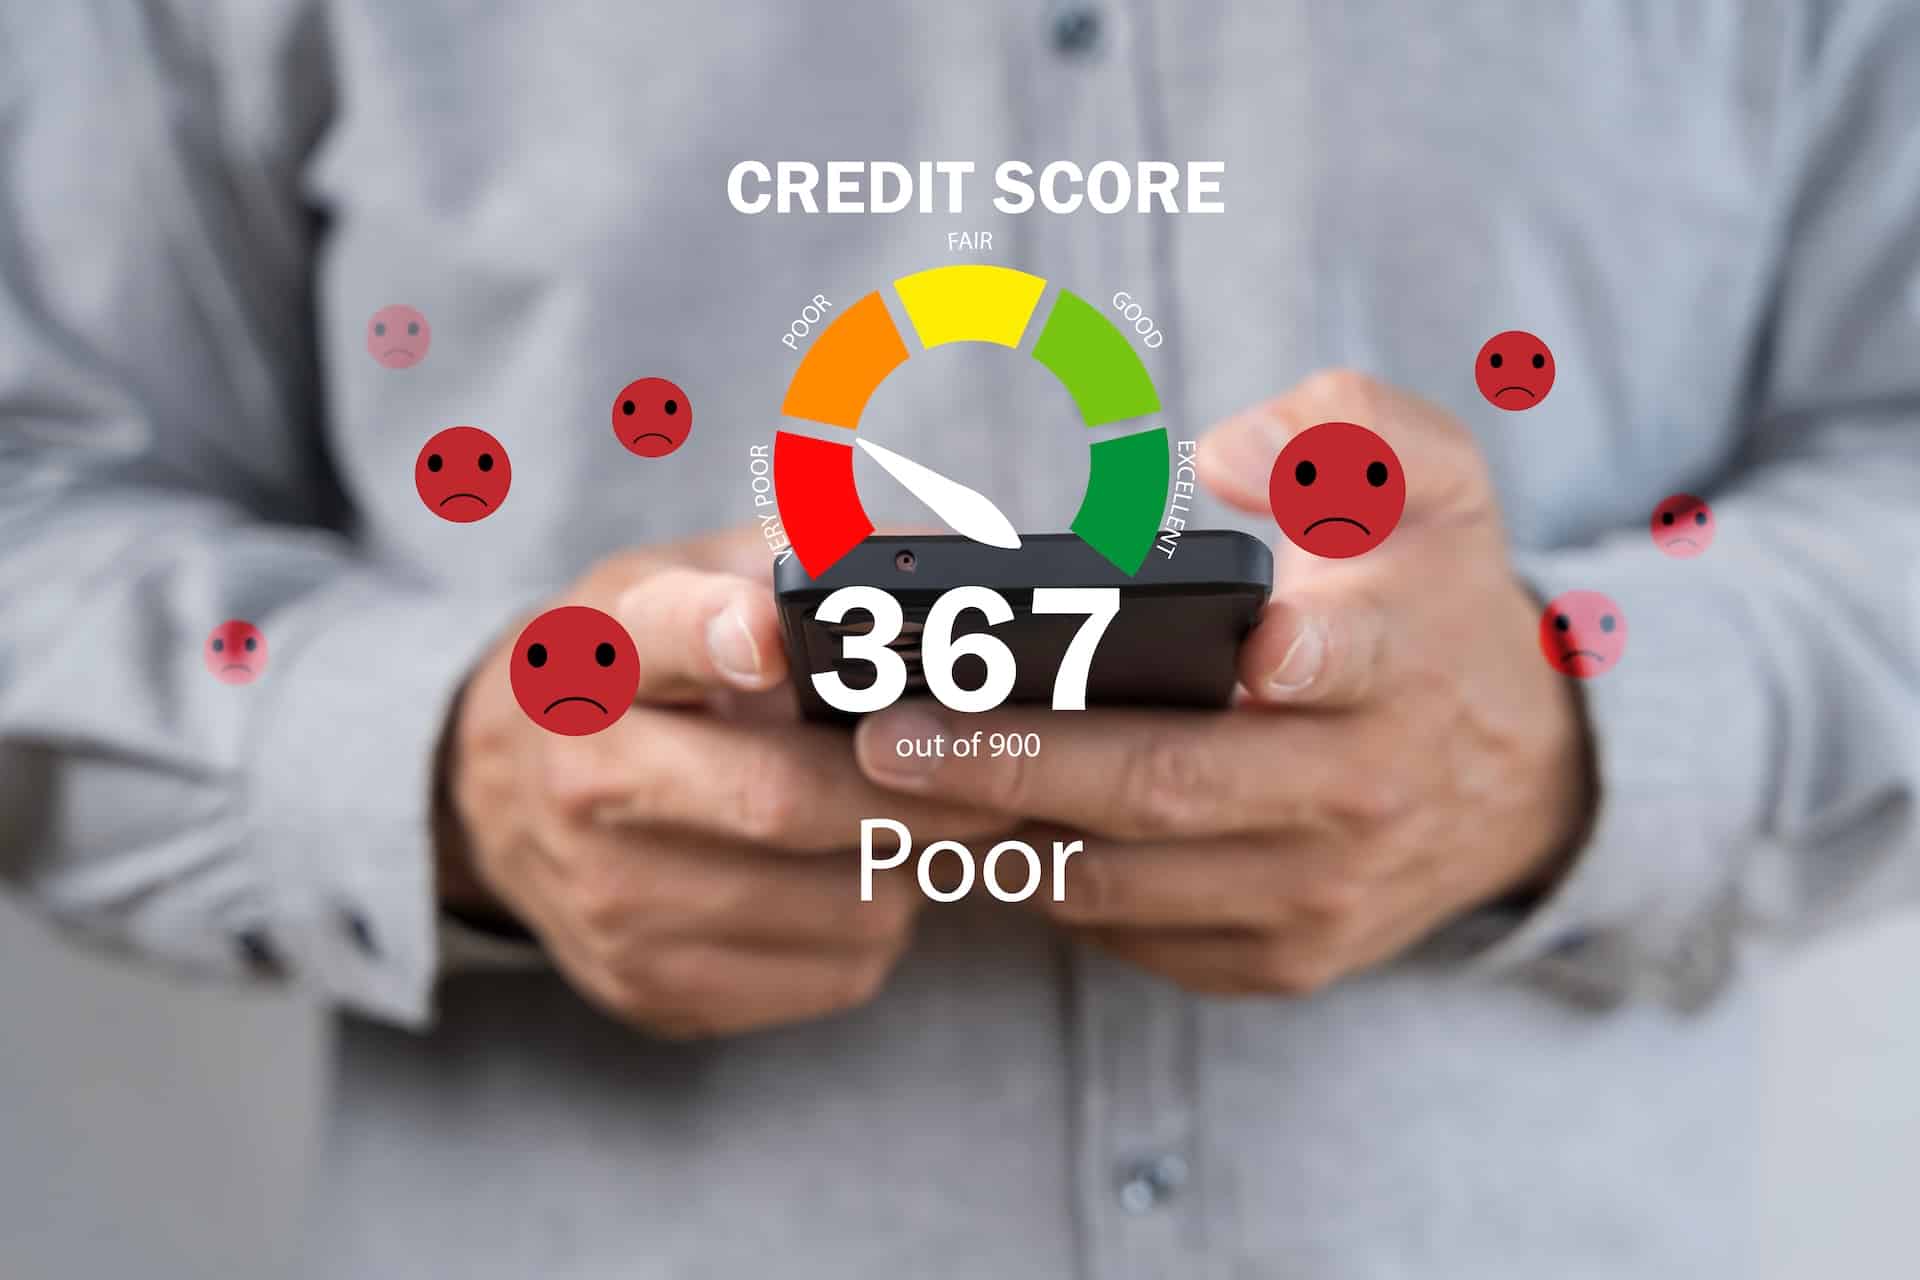
Get updated about changes to your credit profile for free


A digital debit account that helps you save more money.

Build credit history with your daily debit purchases. No credit check required.